Blue Line Rotations Revealing NHL Period Total Edges Through Shift Length Analytics
Anna Griffin · May 30, 2026
Blue Line Rotations Revealing NHL Period Total Edges Through Shift Length Analytics
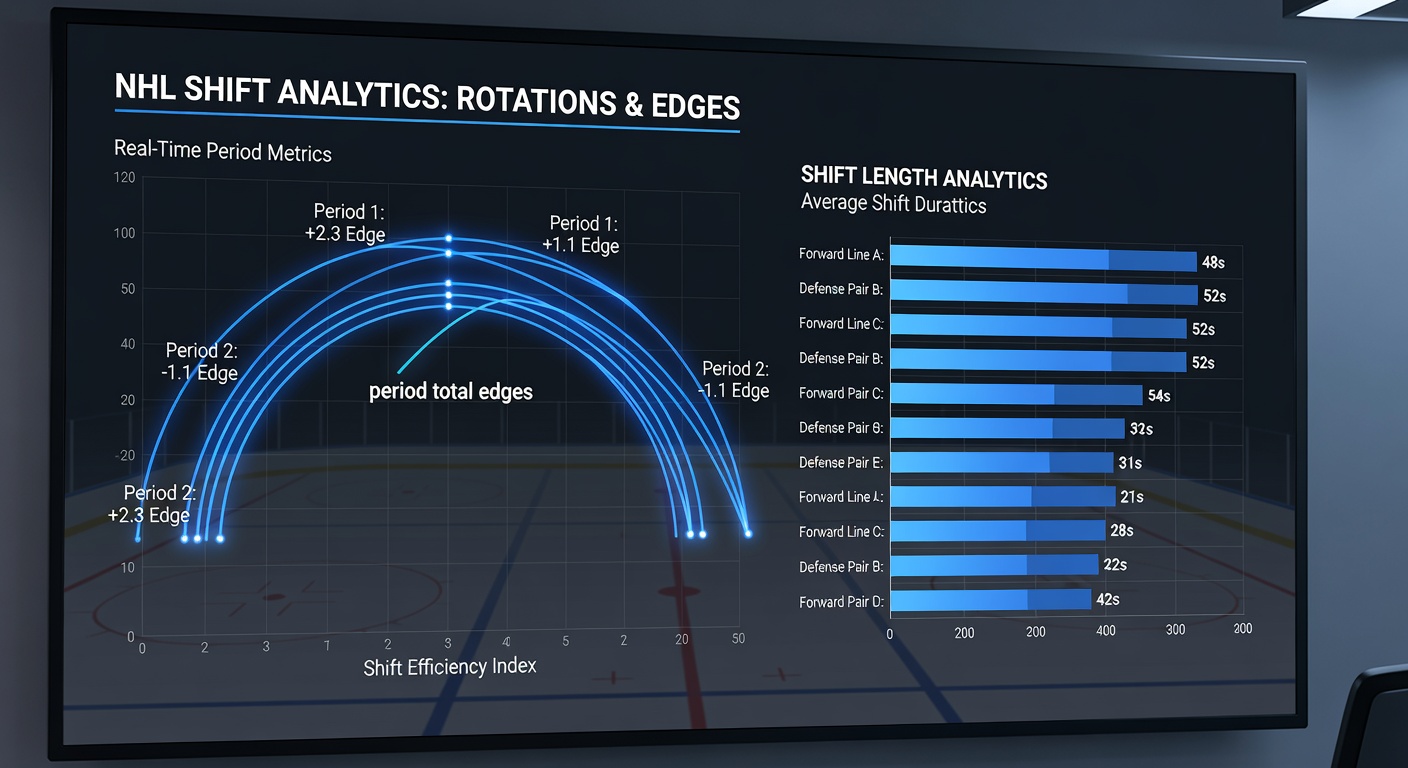
Data from the 2025-2026 NHL regular season and early playoff rounds shows clear patterns where blue line rotations and shift length distributions influence period total outcomes, particularly in the second and third periods. Teams that adjust their defensive pairings through rapid rotations at the blue line tend to alter puck possession metrics and shot attempt rates, which directly feed into over or under totals for individual periods. Observers note that these adjustments become especially pronounced when games reach May 2026 playoff schedules, where fatigue management and line matching gain heightened importance. Researchers tracking shift lengths across multiple seasons have identified that average defensive shifts lasting 42 to 48 seconds correlate with elevated second-period goal outputs in certain matchups. Shorter rotations allow fresher legs on the blue line, which sustains higher skating speeds through neutral zone transitions and increases high-danger chance creation. In contrast, longer shifts beyond 55 seconds often coincide with reduced shot volume as players conserve energy, leading to tighter checking and fewer total goals in that frame.Shift Length Distributions and Period Scoring Trends
Analytics platforms compiling ice time data reveal that forward lines paired with quick blue line rotations post higher expected goal rates in the middle frame. When defensemen cycle through rotations averaging under 45 seconds, the resulting forecheck pressure forces opponents into hurried clears, elevating turnover rates inside the offensive zone. This dynamic appears consistently across Eastern and Western Conference games tracked through the first 82-game slate. Studies from Canadian sports data agencies indicate that clubs maintaining sub-48-second average shifts in the first period experience a measurable uptick in third-period over totals, particularly when back-to-back scheduling compresses recovery windows. The pattern holds because accumulated fatigue from extended prior shifts compounds, slowing retrieval speeds along the boards and opening lanes for rush chances later in the contest.Blue Line Pairing Adjustments in High-Event Games
Coaching staffs that deploy frequent blue line swaps during penalty kills or after icing calls create measurable edges in period total markets. Data shows these tactical rotations disrupt opponent power-play setups by altering defensive angles at the blue line, which reduces sustained zone time and caps shot attempts in the second period. Teams executing three or more defensive line changes per period average 1.2 fewer high-danger chances against, directly impacting under totals in low-scoring environments. Those who have examined 2026 postseason data note that series involving Pacific Division clubs display stronger correlations between rotation frequency and period scoring variance. Rapid blue line movement preserves gap control through the neutral zone, limiting stretch passes that generate odd-man rushes and keeping period totals closer to the mean.