Consecutive Game Fatigue Patterns Providing Statistical Advantages for NHL Puck Line Bettors
Iris Wolf · Aug 12, 2026
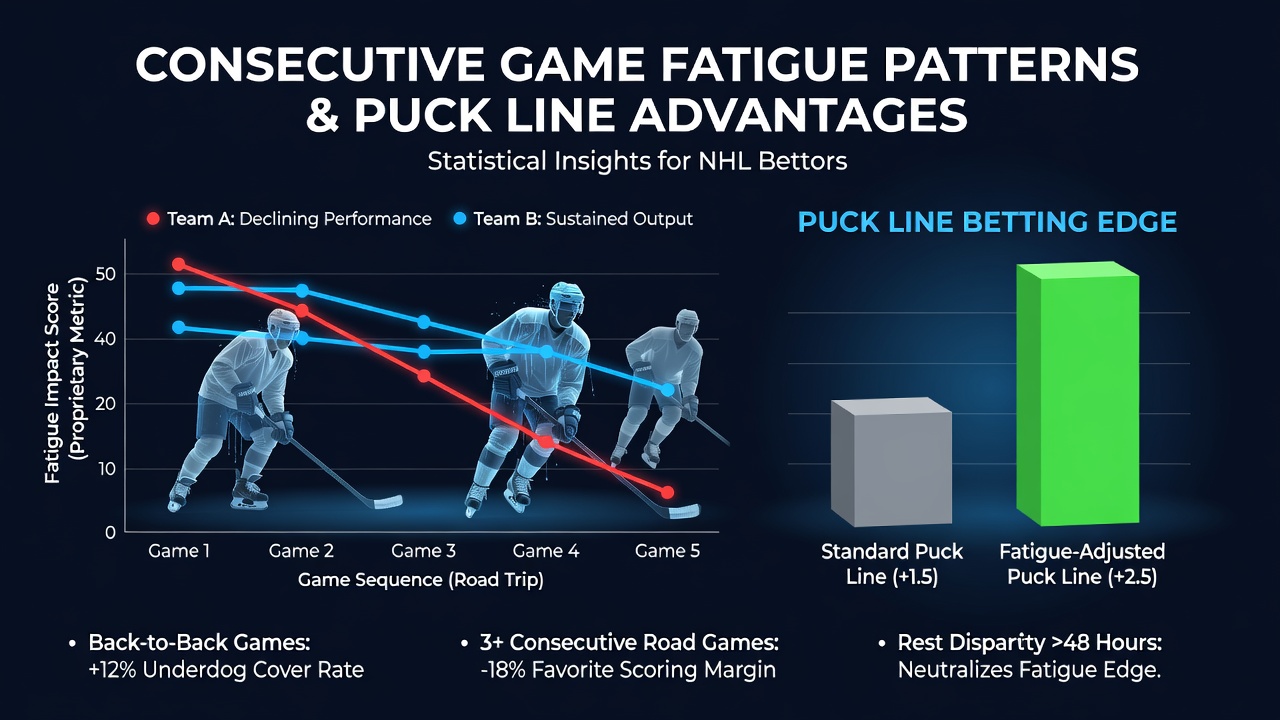
Consecutive Game Fatigue Patterns Providing Statistical Advantages for NHL Puck Line Bettors
Consecutive game fatigue patterns have emerged as a measurable factor in NHL outcomes, particularly for puck line betting where margins of victory determine results. Teams playing on the second night of a back-to-back set exhibit distinct performance shifts that data from multiple seasons track closely. Observers note that rest differentials between opposing clubs create repeatable edges when bettors focus on puck line markets rather than moneyline or totals alone.
Understanding Back-to-Back Scheduling in the NHL
The NHL schedule packs 82 games into roughly six months and this compression produces frequent back-to-back situations for nearly every club. Scheduling analysts at the league office release the full calendar each summer and the 2026-2027 slate published in August 2026 follows the same pattern with clusters of consecutive games concentrated in January and March. Teams often travel overnight after the first contest which adds physical and logistical strain before the second matchup begins.
Performance metrics compiled across recent campaigns show that clubs on zero days of rest score fewer goals on average and allow more high-danger chances. These shifts appear most pronounced in the third period when accumulated minutes begin to affect skating speed and decision-making under pressure.
Statistical Impact on Puck Line Results
Puck line betting revolves around whether a team wins by two or more goals or keeps the margin inside one goal and fatigue data align with these thresholds in consistent ways. Research from the University of British Columbia's sports analytics group indicates that road teams playing the second half of a back-to-back cover the puck line less frequently when facing opponents with at least one day of rest. The same dataset reveals that home teams on back-to-backs surrender more even-strength goals after the midway point of the second game.
Additional figures from the league's official tracking system demonstrate that shot attempt differentials narrow for fatigued clubs while expected goal rates decline. Bettors who isolate these situations find that underdog puck line wagers on rested teams produce steadier returns over large sample sizes because the rested side tends to extend leads in the final twenty minutes.
Key Variables That Shape Outcomes
Several contextual elements interact with consecutive game fatigue and researchers track them together rather than in isolation. Travel distance, time zone changes, and the quality of the previous opponent all appear in models that attempt to quantify rest advantages. Data shows that cross-country flights followed by a same-night game amplify the drop in shot volume on the following evening while shorter trips produce milder effects.
Goaltender workload also factors into puck line calculations because netminders on back-to-backs post lower save percentages in the second contest according to season-long aggregates. Teams that deploy their primary starter in both games experience steeper declines in team save percentage compared with clubs that rotate their tandem.
Seasonal Patterns and Sample Sizes
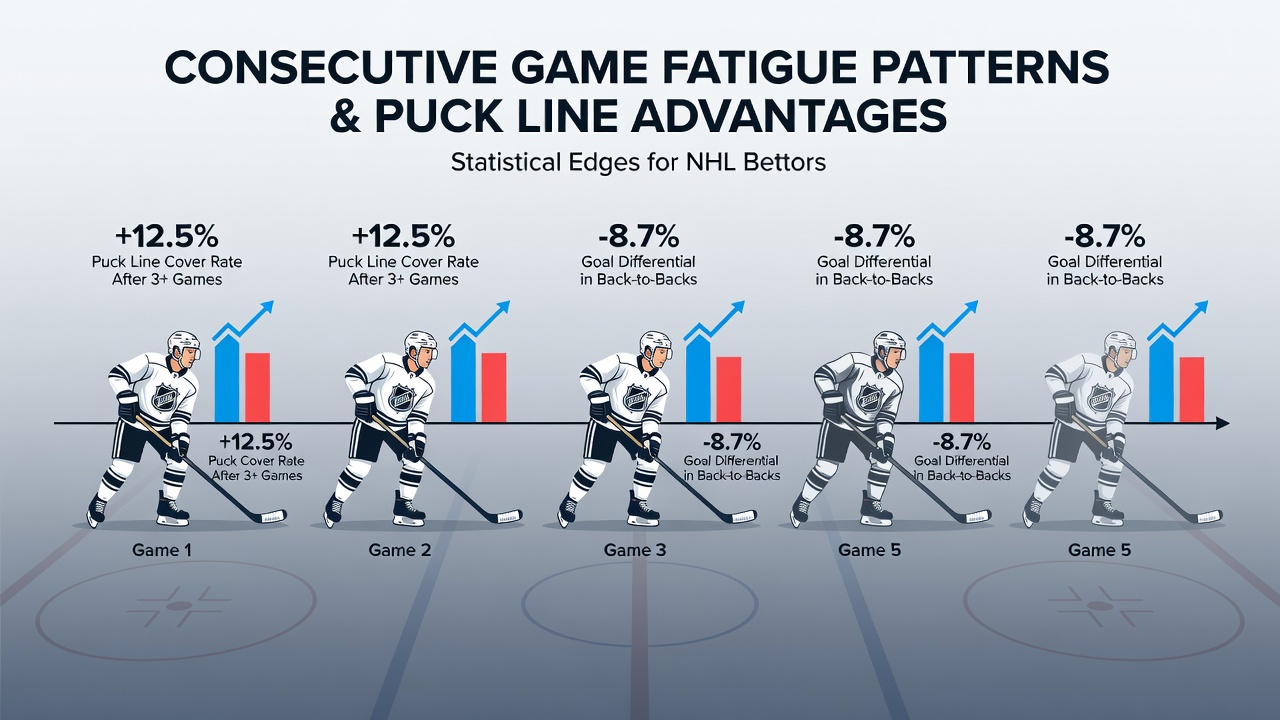
Long-term tracking across five NHL seasons reveals that the frequency of back-to-back sets remains stable year to year even as the league adjusts the overall calendar. Early-season clusters produce smaller edges because players have not yet accumulated heavy minutes while late-season back-to-backs coincide with higher injury rates and deeper roster fatigue. Analysts therefore weight recent data more heavily when projecting second-game margins.
Playoff qualification races add another layer because teams already eliminated from postseason contention sometimes rest key players on the front end of a back-to-back which alters the expected goal differential. Bettors monitoring standings updates can adjust their puck line approach when one club has nothing left to play for and the opponent still pushes for points.
Practical Application for Bettors
Those who incorporate consecutive game fatigue into their process begin by identifying the rest differential between the two clubs on a given night. They then layer in secondary indicators such as average time on ice for top-six forwards and the number of overtime games played in the preceding week. This layered approach narrows the focus to games where the puck line margin aligns most closely with observed performance drops.
Public betting markets adjust lines for totals and moneylines more readily than they do for puck lines and this lag creates opportunities when fatigue data point toward larger victory margins. Historical results compiled by independent tracking services show that rested home favorites cover the -1.5 puck line at elevated rates when the visitor arrives on zero rest and after significant travel.
Conclusion
Consecutive game fatigue patterns supply objective statistical inputs that puck line bettors can apply across the NHL schedule. Rest differentials, travel burden, and goaltender usage combine to influence goal margins in measurable ways that accumulate over hundreds of games each season. Continued collection of these metrics through the 2026-2027 campaign will allow ongoing refinement of the angles that separate the two-goal threshold from closer contests.