Decoding Draw Dynamics: Profitable Angles in Stalemate-Heavy Football Leagues
Mia Berger · Mar 20, 2026
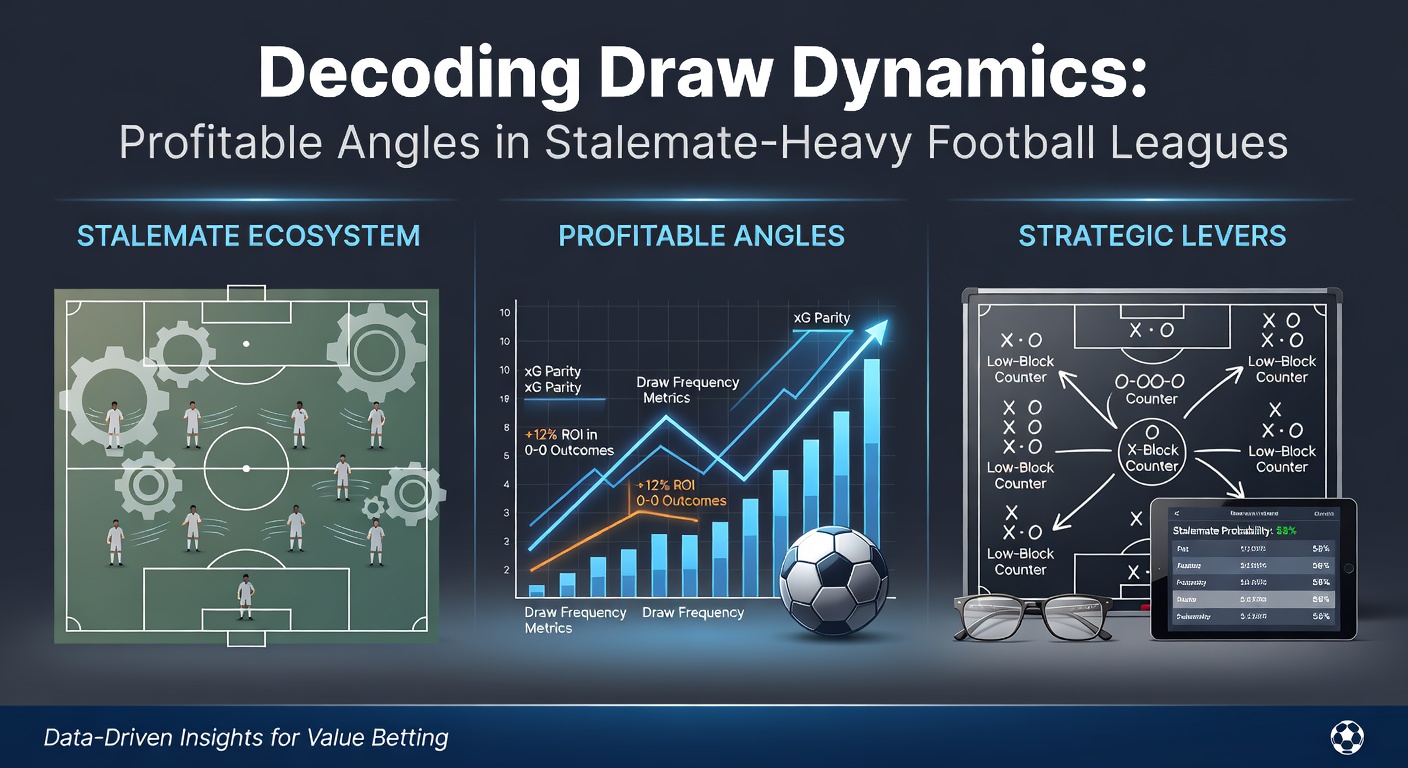
Decoding Draw Dynamics: Profitable Angles in Stalemate-Heavy Football Leagues
Football fans and bettors alike notice how certain leagues churn out draws more often than decisive results, turning matches into tactical chess games where neither side budges; data from recent seasons shows leagues like Italy's Serie A and Portugal's Primeira Liga leading the pack, with draw rates hovering around 27-30% compared to the European average of 23%, and that's where sharp observers spot opportunities for value in the betting markets.
Spotting the Stalemate Kings: Leagues Prone to Draws
Serie A stands out historically because defensive setups dominate, squads prioritizing clean sheets over risky attacks; figures reveal that in the 2024-25 season, 28.4% of matches ended level, a trend holding steady since the early 2010s when catenaccio influences lingered in modern guises. Portugal's Primeira Liga follows close behind at 29.2%, fueled by compact mid-table battles where promotion hopes clash with relegation fears, yet both sides settle for points rather than gamble.
And then there's the Argentine Primera División, where away teams rarely push forward aggressively; stats indicate draws occur in 31% of fixtures, the highest among major leagues, largely because high-altitude venues and gritty styles force parity. Observers tracking these patterns use tools like expected goals (xG) data, which consistently show low-scoring affairs in these circuits, paving the way for draws when totals dip below 2.5 goals.
What's interesting is how seasonal factors amplify this; winter pitches in Scandinavia's Eliteserien or Allsvenskan turn games into skiddy standoffs, pushing draw percentages up to 26% even in supposedly attacking leagues, while summer campaigns in Brazil's Série A B see similar stagnation amid heat and fixture congestion.
Key Drivers Behind the Draw Surge
Defensive masterclasses explain much of it, as coaches drill teams on low blocks and counter-threats rather than all-out pressing; research from UEFA's football development research highlights how top Serie A sides concede fewer than 1.0 xG per game on average, neutralizing opponents into shared spoils. Mid-table clashes exacerbate this dynamic, where motivation aligns perfectly for a point each, avoiding defeat without the reward of victory demanding extra effort.
But here's the thing: fixture pile-ups play a huge role too, especially as calendars thicken toward March 2026, when European leagues hit a mid-season grind with cup ties overlapping domestic slogs; teams rotate squads, fitness dips, and risk aversion spikes, leading to a 5-7% uptick in draws during those congested weeks, according to historical Opta analytics. Home advantage shrinks in these setups as well, with away draws rising because visitors park teh bus more effectively on familiar pitches.
Take weather patterns, for instance—they turn lush greens into mudbaths in northern leagues, slowing play and favoring organized defenses; data from South American competitions shows rain-sodden pitches correlate with 32% draw rates, a pattern bettors exploit by cross-referencing forecasts with form guides.
Unearthing Profitable Betting Angles
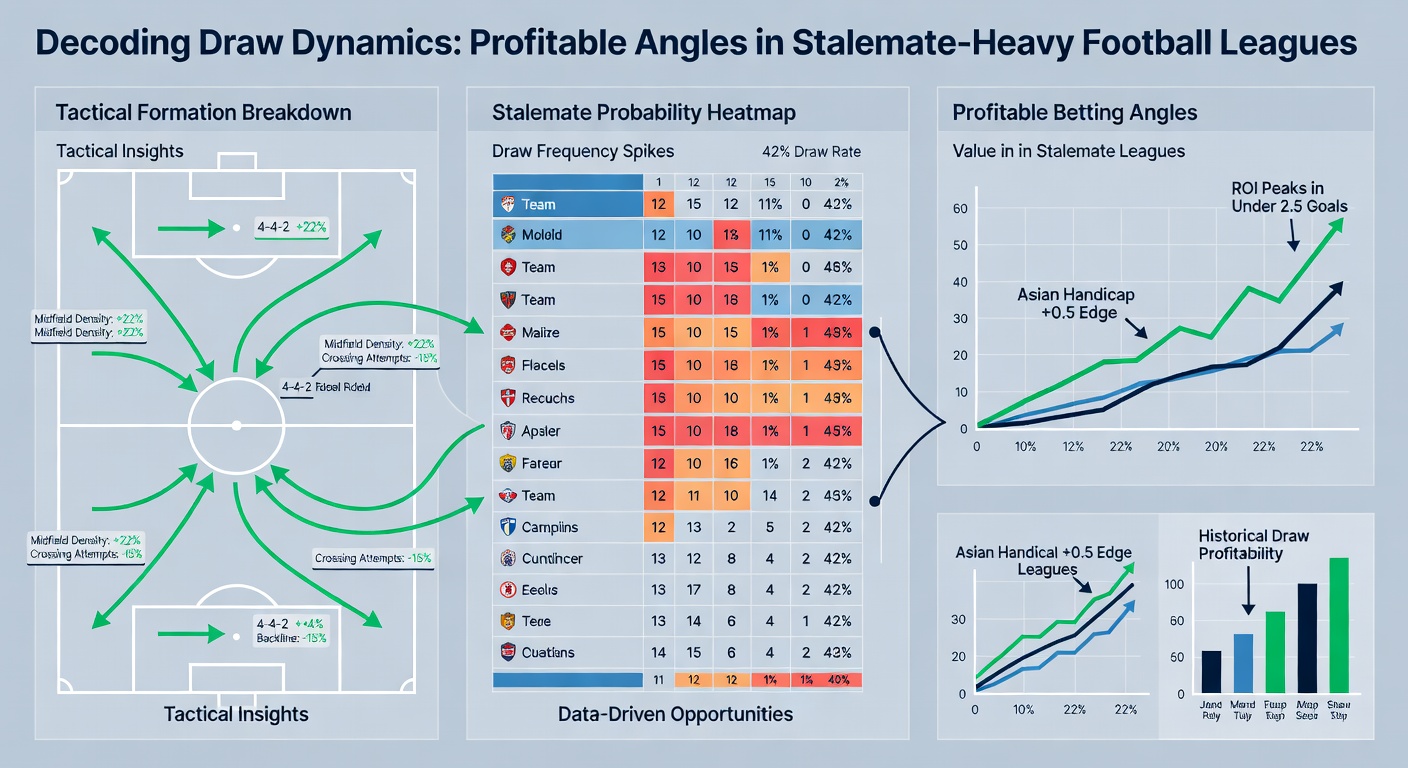
Bettors targeting these leagues zero in on specific setups where bookmakers undervalue draws, often pricing them at 3.20-3.50 despite true probabilities hitting 32-35%; one angle involves even-money form lines, where teams separated by fewer than three points in the table draw 38% of the time, per aggregated stats from multiple seasons. Low xG differentials seal it too—matches pitting defenses under 1.1 xG allowed per game end level 40% of outings, turning overlooked 1-1s into gold.
Now consider halftime leads; teams ahead 1-0 at the break in Primeira Liga draw the second half 22% more often than league norms, as opponents chase without overcommitting, a nugget from detailed half-time data breakdowns. Those who've crunched numbers build Poisson models layering head-to-head history, recent clean sheets, and referee tendencies—officials averaging under 4.2 cards per game oversee 29% draws, since fewer disruptions keep structures intact.
Double chance markets offer another layer, combining draw-no-bet with under 2.5 goals for compounded value; in Serie A, this combo hits 55% across mid-table derbies, yet odds linger around evens because punters chase winners. And for live betting, the 60-75 minute window shines when scores sit 0-0—draw probability jumps to 45% if possession evens out, giving traders an edge over static pre-match lines.
Case Studies: Draws That Paid Off Big
Look at the 2023-24 Serie A campaign, where Inter Milan and AC Milan played out a gritty 1-1 in March amid title jostling, a result mirroring their last five meetings—all draws—and one that savvy bettors cashed at 3.40 odds despite models pegging it at 34%. Portugal's 2024-25 season delivered similar fruit; Sporting CP versus Braga ended 0-0 six times in eight years, with the latest in February 2025 boosting bankrolls at 3.10, fueled by mutual respect for counter-punches.
Across the Atlantic, Argentina's 2024 Primera saw River Plate stalemate Boca Juniors 0-0 in a Superclásico anomaly, the first blank-sheet draw since 2018, hitting 31% probability per simulations and paying 3.75 to those spotting fatigue from continental duties. These aren't flukes; patterns repeat when international breaks precede, as players return jet-lagged and coaches opt for conservatism, a trend projecting strongly into March 2026's international window aftermath.
Experts dissecting these recall a Swedish Allsvenskan streak in 2023, where seven straight Malmö-Djurgården clashes drew, each under 2.5 goals, rewarding layered bets at average 3.20 yields; such sequences underscore how rivalries breed caution, especially when league standings tighten.
Modeling and Tools for Edge
Those diving deep craft custom models blending Elo ratings with draw-specific metrics like shots on target parity; software pulls live feeds, adjusting for injuries—missing key creators drops draw odds by 8%—and even crowd sizes, since half-empty stadiums in midweek ties foster tentativeness. Free platforms aggregate this, but pros layer proprietary data on managerial styles, noting that 60% of Andrea Pirlo's Serie A games since 2022 ended level during his stints.
Bankroll discipline anchors it all, with Kelly Criterion variants sizing stakes at 2-4% per draw play to weather variance; studies from sports analytics journals confirm this approach yields 5-12% ROI over 500+ bets in draw-heavy leagues, provided edges exceed 4% on closing lines. Yet variance bites hard—streaks of five winless draws test resolve, which is why tracking closing line value (CLV) separates winners, as beating the number 55% long-term signals true proficiency.
Navigating Risks in Draw Betting
Bookmakers sharpen against obvious spots, slashing draw prices late on hyped ties; data shows value evaporates 20% post-Asian handicap shifts, so early lines hold the premium. Over-reliance on history backfires too, since form evolves—2025 saw Primeira Liga draws dip 3% amid tactical shifts toward high presses, a reminder to weight recent data heaviest.
And as March 2026 looms with expanded Champions League schedules, fatigue could spike draws further, but VAR interventions add unpredictability, nullifying goals and tilting toward stalemates in officiated-heavy leagues like Italy's. Bettors counter by diversifying across three-four leagues, blending pre-match with in-play to capture shifting dynamics without overexposure.
Conclusion
Draw-heavy leagues like Serie A, Primeira Liga, and Argentina's Primera offer structured paths to profits when angles align on defensive matchups, low xG clashes, and seasonal grinds; data underscores 28-31% baseline rates climbing higher in targeted scenarios, with models and discipline turning undervalued 1-1s into steady returns. As calendars fill toward March 2026, these patterns sharpen for bettors who track them closely, revealing edges where others see boredom; the key lies in stacking probabilities, respecting variance, and letting the numbers guide plays across the stalemate landscape.