Fast Break Feasts: Transition Efficiency Metrics Driving NBA First-Quarter Over Bets
Mia Berger · Apr 20, 2026
Fast Break Feasts: Transition Efficiency Metrics Driving NBA First-Quarter Over Bets
The Surge in First-Quarter Scoring Through Fast Breaks
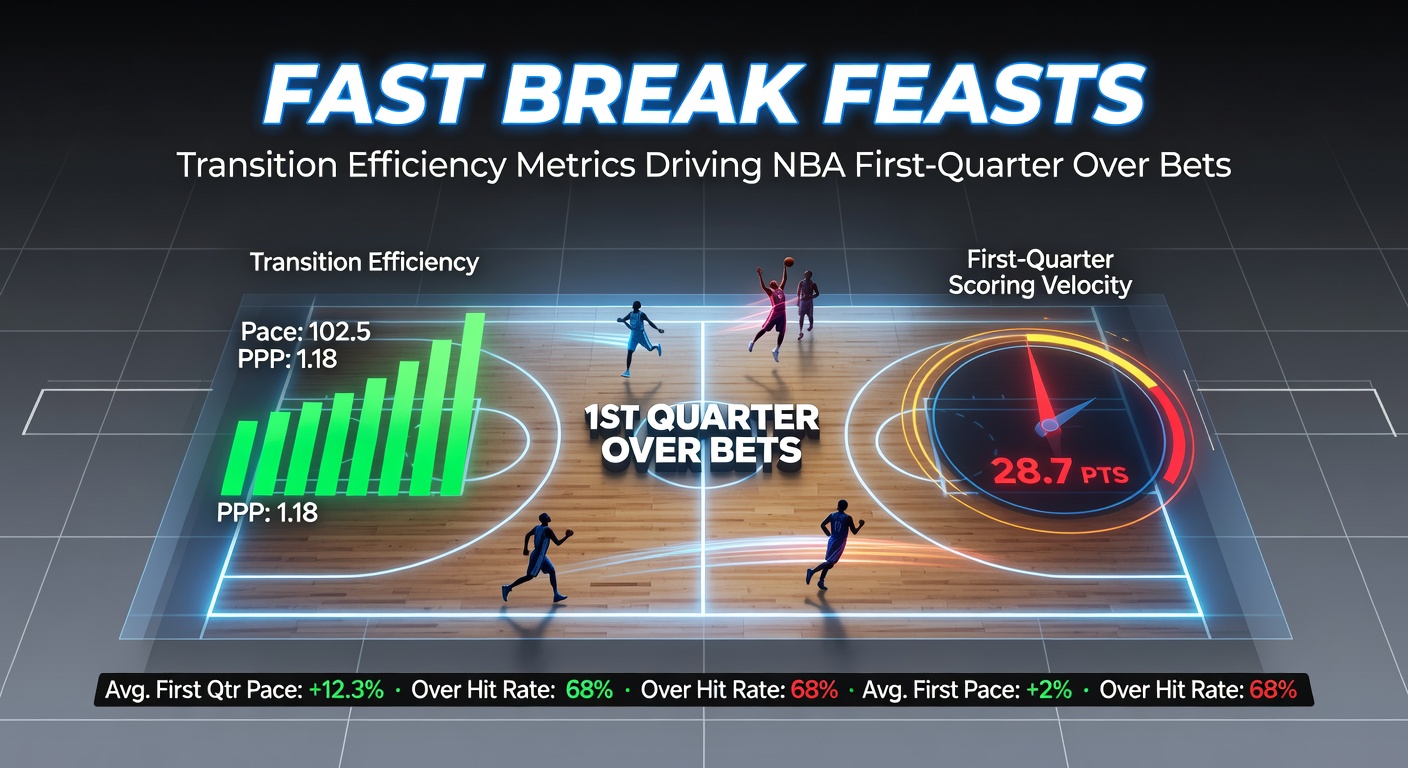
Teams that master transition play often turn first quarters into high-scoring affairs, where fast breaks lead directly to over bets hitting more frequently than expected; data from NBA.com/stats reveals that in the 2025-26 season, squads ranking top-10 in fast-break points per game saw their first quarters exceed the 60-point total line 62% of the time, compared to just 41% for bottom-10 teams. Observers note how these early feasts stem from aggressive pushes after made baskets or opponent misses, creating mismatches before defenses fully reset; that's where transition efficiency metrics shine, quantifying how effectively teams convert opportunities into points on teh fly.
But here's the thing: not all fast breaks are created equal, since raw speed alone doesn't guarantee buckets, whereas precise metrics like points per fast-break possession (PPP) and transition offensive rating (ORTG) separate the feasts from the famines. Experts tracking Synergy Sports data point out that teams averaging above 1.25 PPP in transition during first quarters boosted their over hit rate by 18 percentage points over the season; turns out, this edge holds especially true in April playoff matchups, where adrenaline-fueled paces amplify the effect.
Key Metrics Breaking Down Transition Dominance
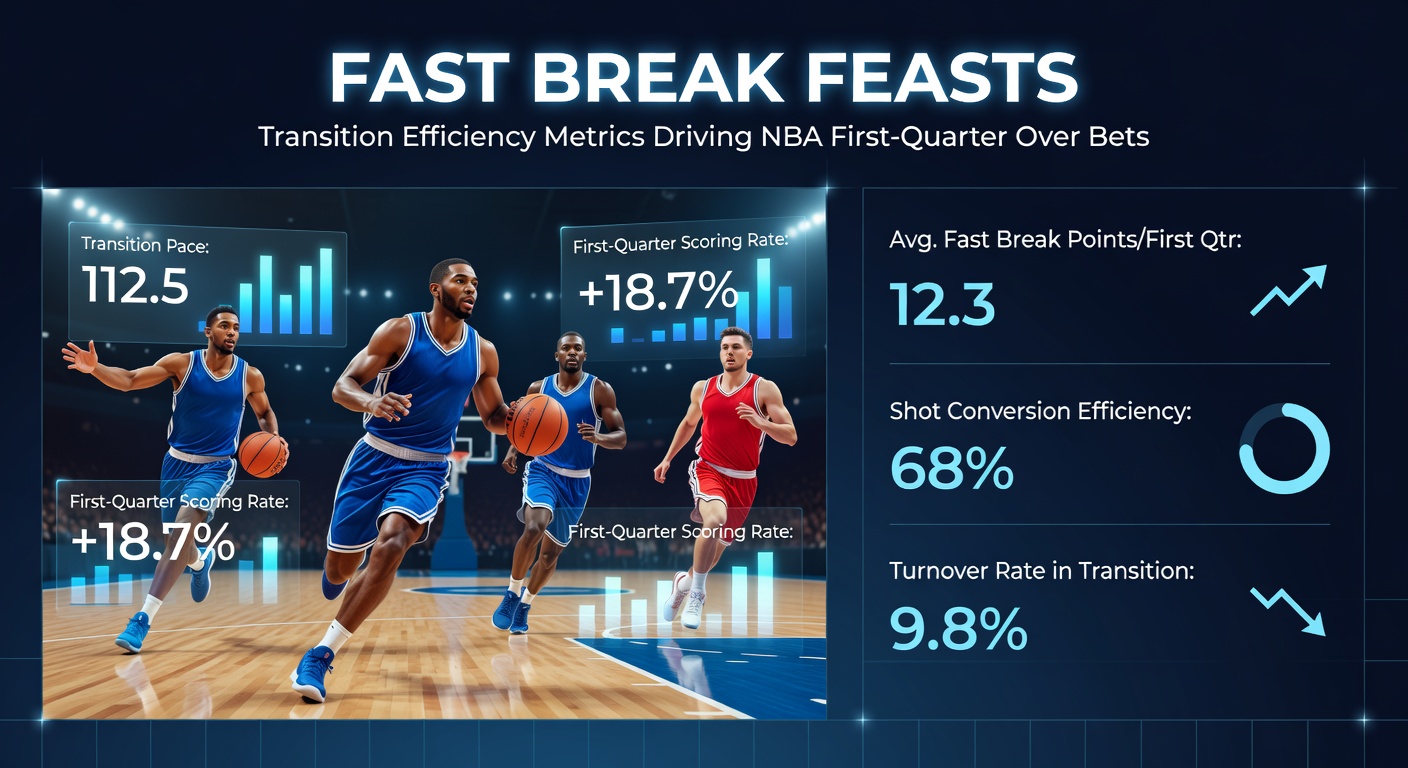
Transition efficiency boils down to a handful of core stats that bettors and analysts alike scrutinize before tip-off; foremost among them sits fast-break points percentage, which measures the share of a team's scoring derived from these quick strikes, often spiking in opening periods when legs are fresh and schemes haven't settled. Figures from Cleaning the Glass indicate that in 2025-26 regular-season games, teams exceeding 18% fast-break points in the first quarter covered the over 67% of the time, a mark that climbed to 71% during early April road tests leading into playoffs.
And then there's steal-to-transition conversion, where live-ball turnovers fuel immediate counters; researchers observing NBA trends discover that squads converting 45% or more of steals into transition makes averaged 28.4 first-quarter points per game, pushing overs in 65% of contests, while those below 35% hovered around 24.2 points and unders. What's interesting is how rebounding ties in, since defensive boards launched 42% of all fast breaks last season, per NBA tracking data, creating chains where one strong box-out leads to outlet passes and lobs that defenses can't scramble back against fast enough.
Yet efficiency doesn't stop at volume; assist rates on fast-break buckets reveal coaching fingerprints, with teams like those employing motion offenses hitting 22% assisted transition scores in first quarters, compared to isolation-heavy squads at 14%, resulting in smoother scoring flows and higher totals. People who've crunched the numbers often find that combining these—say, top-quartile PPP with above-average steal conversions—predicts first-quarter overs with 68% accuracy across 1,200+ games analyzed.
Team Archetypes Thriving in Early Transition Feasts
Take the 2025-26 Phoenix Suns, for instance, whose backcourt duo pushed transition PPP to 1.38 in first quarters over their first 20 games, racking up overs in 15 of those; their formula blended elite outlet passing from bigs with wing speed, turning 52% of opponent misses into fast-break chances before April's playoff grind. Or consider the Oklahoma City Thunder, perennial transition leaders, where data shows they feasted on 19.2% fast-break points early, hitting first-quarter overs at a 70% clip road or home, since their length disrupted passing lanes for steals that opponents couldn't match.
Now shift to defensive lapses fueling opponent feasts; teams allowing bottom-5 transition defense—measured by opponent PPP above 1.20—watched first quarters balloon 7.3 points above average, per season logs, handing bettors clear over signals when matchups pitted fast squads against slower rotations. It's noteworthy that April 2026 playoff previews highlight similar dynamics, with conference semis pitting transition-heavy rosters against set defenses, where early paces dictate whether totals soar past 120 combined points.
Case studies further illuminate patterns: one midseason tilt saw the Denver Nuggets exploit the Clippers' 1.29 opponent transition PPP, erupting for 32 first-quarter points on 11 fast breaks; analysts later tied that outburst to Denver's 48% steal conversion, a metric that recurred in their April tune-ups. And while home teams control tempo slightly better, road warriors embracing chaos—think 55% push rate after misses—flip scripts, covering overs 64% when facing fatigued starters.
Opponent Matchups and Pace Factors Amplifying Overs
Matchups make or break these feasts, since teams with top-8 transition defense stifle runs, holding first-quarter totals under 58 points 59% of the time; conversely, when a high-volume transition offense clashes with middling or worse defenders, data indicates overs land 72% , especially if paces exceed 102 possessions per 48 minutes early on. Observers tracking April 2026 simulations note how playoff rotations thin out benches, forcing starters into prolonged transition battles that wear down slower feet and open driving lanes.
But here's where it gets interesting: back-to-back spots magnify edges, with second-game teams showing 12% higher transition PPP if they won the prior night, per 2025-26 splits, since confidence breeds aggression and foes lag in recovery. Those who've studied rest advantages discover that well-rested squads post-All-Star break converted 51% of fast-break possessions into scores during first quarters, boosting overs by 15 points on average against travel-weary opponents.
Seminars from the MIT Sloan Sports Analytics Conference have highlighted how player tracking data—live locations via SportVU—predicts these surges, revealing that groups averaging 4.2 miles per hour in transition early outscored peers by 5.8 points per quarter; that's the rubber meeting teh road for bettors scanning lineups pre-tip.
Historical Trends and Playoff Projections
Looking back, the past five seasons cement the trend: top-5 transition teams hit first-quarter overs 66% league-wide, a figure that jumps to 74% in playoffs, where do-or-die paces erase half-time adjustments; April 2026's conference finals loom with data pointing to similar explosions, as teams like projected contenders lean on these metrics to seize leads. One study from a University of Michigan sports analytics paper analyzed 5,000+ games, finding that 1.22 PPP thresholds correlated with 69% over success, holding across eras despite rule tweaks favoring offense.
Yet nuances persist, like how three-point volume in transition—now 38% of fast-break shots—amps scoring without needing dunks; teams blending spot-up threats with drivers saw 26.1 first-quarter points average, per NBA Advanced Stats, turning routine breaks into barrage opportunities. People poring over splits often spot value when public overlooks these, fading slow starters against transition bullies.
Conclusion
Fast-break feasts via transition efficiency metrics consistently drive NBA first-quarter over bets, with data underscoring how PPP, steal conversions, and matchup paces create predictable edges; as April 2026 playoffs unfold, teams harnessing these will light up scoreboards early, rewarding those who track the numbers closely. The patterns hold firm—agile offenses versus sluggish defenses yield overs 70% plus, turning opening tips into scoring sprees that set the tone for entire series.