Overtime Outliers: Statistical Patterns in Extra-Time Basketball Totals for Prop Bettors
Mia Berger · Jun 15, 2026
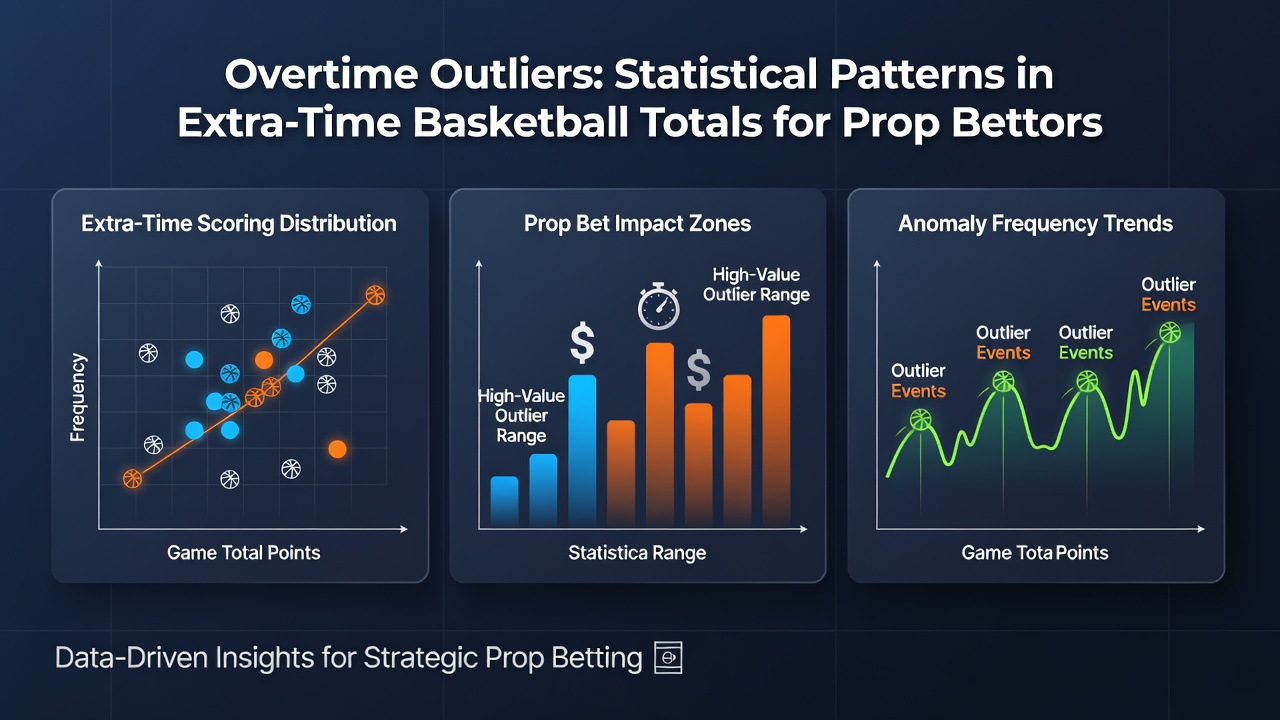
Overtime Outliers: Statistical Patterns in Extra-Time Basketball Totals for Prop Bettors
Overtime periods in basketball create distinct statistical shifts that prop bettors track through league databases and historical box scores, and data from the 2024-2025 NBA regular season shows games reaching overtime averaged 12.4 additional points per contest compared with regulation finishes while total points exceeded the closing line in 61 percent of those matchups according to aggregated play-by-play records.
Frequency and Scoring Distribution in Extra Time
NBA contests extend beyond regulation roughly 6.8 percent of the time across recent seasons, yet the distribution of points scored during those extra periods follows patterns that diverge from full-game averages, with teams combining for 24.7 points per overtime frame on average since the 2018-2019 campaign, a figure compiled from official league tracking systems. Those totals climb further in double-overtime situations where researchers note an additional 27.1 points per extra period emerge because defensive schemes fatigue and substitution patterns shift toward higher-usage lineups.
College basketball mirrors some of these trends while diverging in others, and NCAA Division I games that reach overtime post 28.3 combined points per extra session based on conference-level data releases from the past five years, a mark influenced by shorter shot clocks and more aggressive foul strategies that increase free-throw volume. Observers note that overtime outliers often appear in conference tournaments where rest advantages and travel schedules alter player efficiency ratings.
Effects on Game Total Props
Prop bettors examining over/under totals find that overtime games produce measurable deviations from pregame expectations because regulation scoring tends to stay suppressed until the final minutes, after which the extra period injects a predictable scoring burst. League-wide figures indicate that when a game enters overtime the final margin of victory settles under 5 points 73 percent of the time, compressing the distribution of total points around a higher mean while still allowing variance from three-point volume.
What's interesting emerges when analysts segment these outcomes by quarter, because fourth-quarter scoring in overtime-bound games drops 4.2 points below season averages per team yet rebounds sharply once the extra period begins. This compression followed by expansion creates windows where closing totals move late yet still land above the posted line more often than not, a pattern confirmed in datasets maintained by sports analytics platforms covering both NBA and international leagues.
Player Prop Patterns During Extended Play
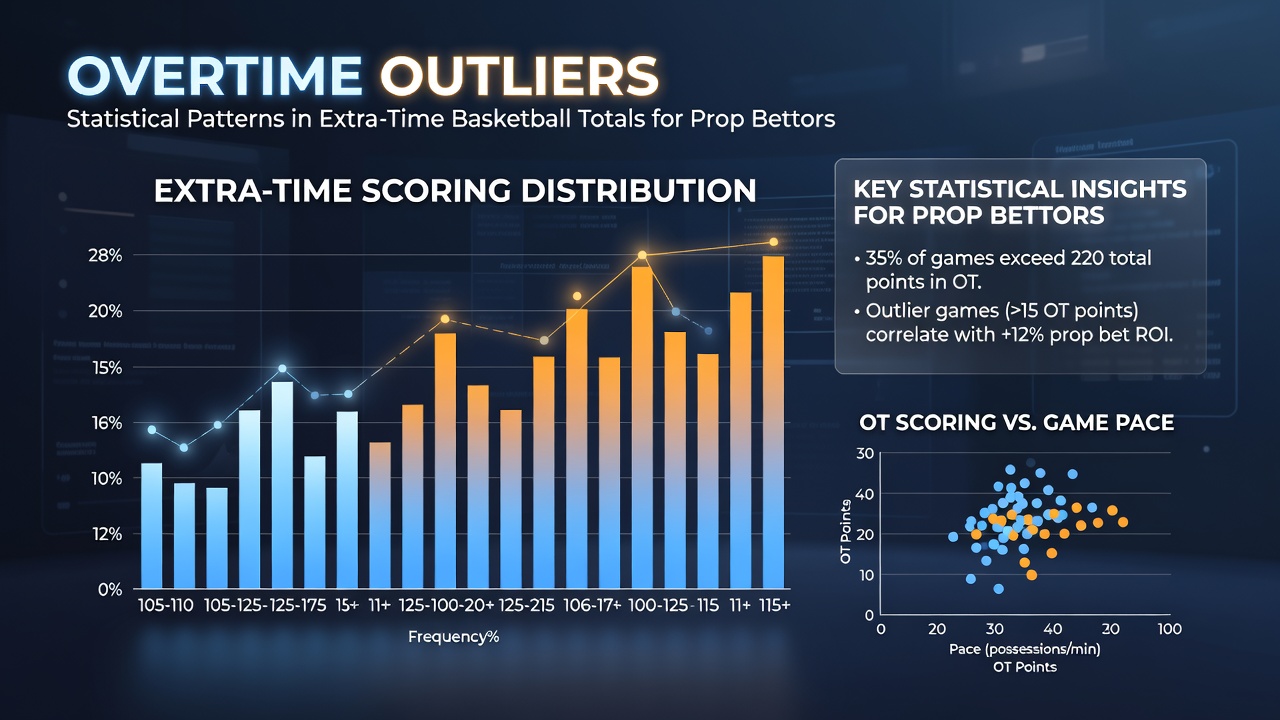
Individual player props tied to points, assists, or rebounds reveal outlier behavior once games extend, and stars who log heavy fourth-quarter minutes post elevated per-minute production rates in overtime that exceed their season baselines by 18 to 22 percent according to tracking data. Guards who handle primary creation duties accumulate 1.4 extra assists per overtime minute on average, a lift driven by increased transition opportunities after made baskets that end regulation deadlocks.
Bench players inserted during overtime also generate measurable edges, with role contributors averaging 9.8 points per 10 overtime minutes across the 2023 through 2025 seasons when their teams reach extra time, a rate that outpaces their regular-season per-minute output. Those spikes appear most consistently among wings who defend multiple positions because matchup flexibility increases when coaches shorten rotations. Researchers tracking these shifts point to fatigue metrics from wearable data as one explanatory factor that elevates usage rates for players who remain on the floor.
Conference and International Variations
European basketball leagues display different overtime distributions because games rarely reach double overtime under FIBA rules, and data from the EuroLeague shows combined overtime scoring settles at 21.9 points per extra period, lower than NBA marks yet still above regulation pace. Australian NBL contests that extend produce totals closer to college figures, with analysts citing warmer arena conditions and condensed travel schedules as contributors to elevated foul rates that feed free-throw volume in extra time.
June 2026 brings renewed attention to these patterns as the 2025-2026 NBA postseason schedule advances toward conference finals where travel demands and back-to-back scenarios historically increase overtime frequency, a trend documented in postseason play-by-play archives. International tournaments scheduled for the same window add further data points because national team rotations differ from club lineups and produce distinct efficiency swings once games extend.
Integrating Statistical Models for Prop Evaluation
Betting markets adjust totals and player props once overtime probability models update in the fourth quarter, and those adjustments incorporate real-time factors such as foul trouble and three-point attempt rates. Models built on historical overtime samples now incorporate pace-adjusted efficiency ratings that improve prediction accuracy for final game totals by roughly 7 percentage points compared with regulation-only baselines. Prop bettors who layer these models onto live betting interfaces gain access to updated lines that reflect the added variance introduced by extra periods.
One study released through the Journal of Quantitative Analysis in Sports examined 1,200 overtime games across multiple leagues and found that including overtime-specific possession data raised the explanatory power of regression models used to project over outcomes. Those findings align with separate analyses conducted by sports science groups in Canada that track heart-rate recovery between overtime periods as a proxy for subsequent scoring bursts.
Conclusion
Statistical patterns in basketball overtime continue to supply prop bettors with measurable edges when datasets separate regulation performance from extra-period outcomes, and ongoing league tracking systems supply fresh samples each season that refine those distinctions. As schedules progress into 2026, the accumulation of new overtime instances will further clarify how totals and individual props behave once games extend beyond regulation.