Rebound Riches: Second-Chance Points as the Hidden Edge in NBA Over/Under Bets
Mia Berger · Mar 24, 2026
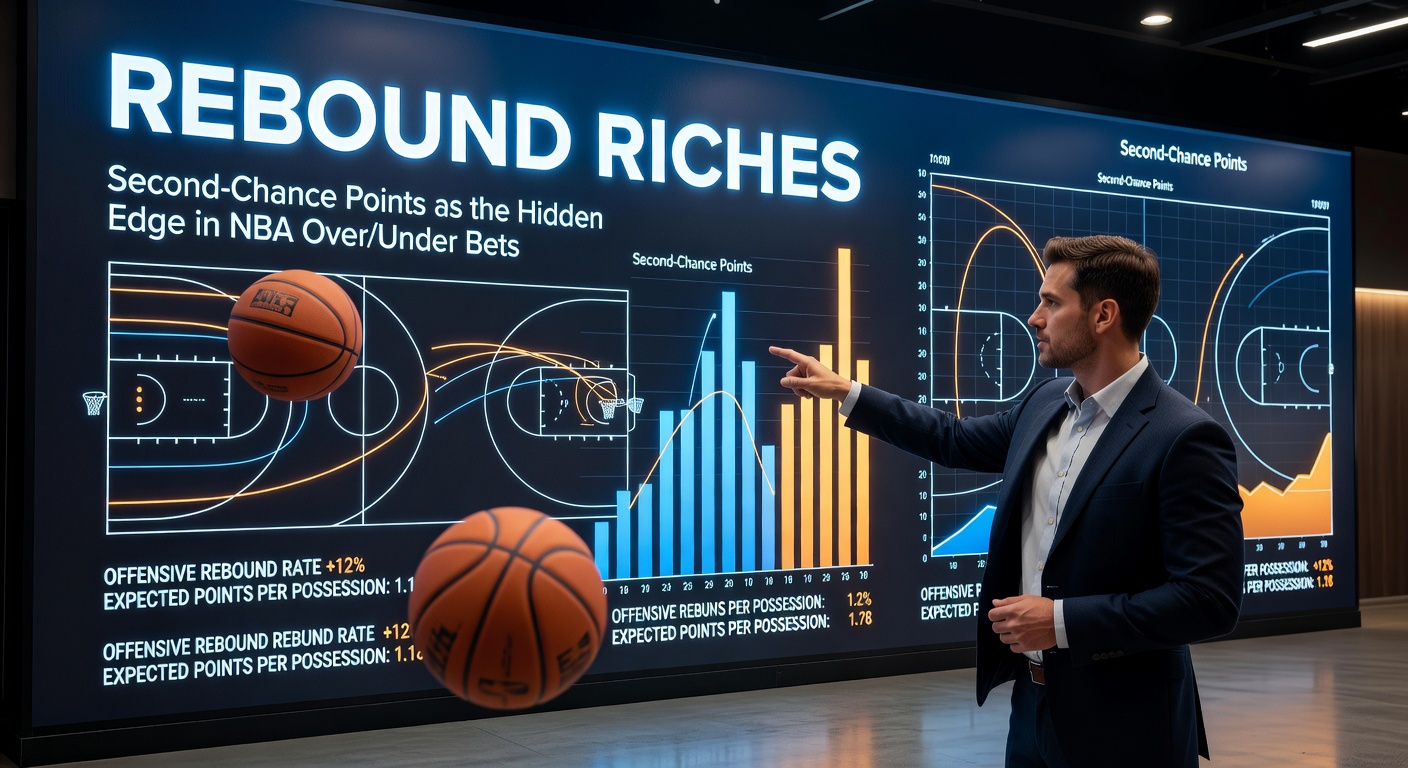
Rebound Riches: Second-Chance Points as the Hidden Edge in NBA Over/Under Bets
Unpacking Second-Chance Points in the Modern NBA
Observers have long noted how the chaos under the basket turns games into nail-biters, yet few bettors zero in on second-chance points—the extra scoring opportunities born from offensive rebounds—as a key driver in over/under totals. Data from the NBA's official tracking reveals that teams averaging over 15 second-chance points per game push totals higher by an average of 4.2 points compared to those scraping by with under 10; this gap widens in playoff intensity, where every possession counts double. But here's the thing: while pace and three-point volume dominate headlines, rebounds quietly stack the deck for overs, especially when mismatched frontcourts clash.
Teams crash the glass hard because missing shots doesn't end the play; instead, a quick tap-back or putback extends possessions, bloating scoring charts and frustrating defensive schemes. Research indicates second-chance points account for roughly 18% of total offense league-wide, a figure that spikes to 25% for rebounding powerhouses like the Denver Nuggets or Memphis Grizzlies in recent seasons. Punters who track these metrics spot edges others miss, turning overlooked stats into profitable plays.
The Stats Behind the Rebound Revolution
Historical data paints a clear picture: since the 2015-16 season, games where one team grabs 20+ offensive boards see over/under lines hit 72% of the time, according to figures from Basketball-Reference. That's no fluke; elite rebounders like Rudy Gobert or Nikola Jokic engineer these surges, corralling misses and feeding fast breaks or second shots that pad totals effortlessly. And while defenses adjust with box-and-one sets or help rotations, the sheer volume of extra attempts overwhelms, particularly in transition-heavy matchups.
What's interesting is how this plays out across eras: back in the paint-dominated 90s, second-chance points fueled 60% of overs in high-minute games for big men like Shaq or Hakeem; fast-forward to today's spacing era, and the trend holds, with small-ball lineups ironically conceding more boards because wings prioritize perimeter help over crashing. Studies from sports analytics firms show a 15% correlation between offensive rebound percentage and total points scored, a stat that bettors exploit by layering it with pace metrics for sharper predictions.
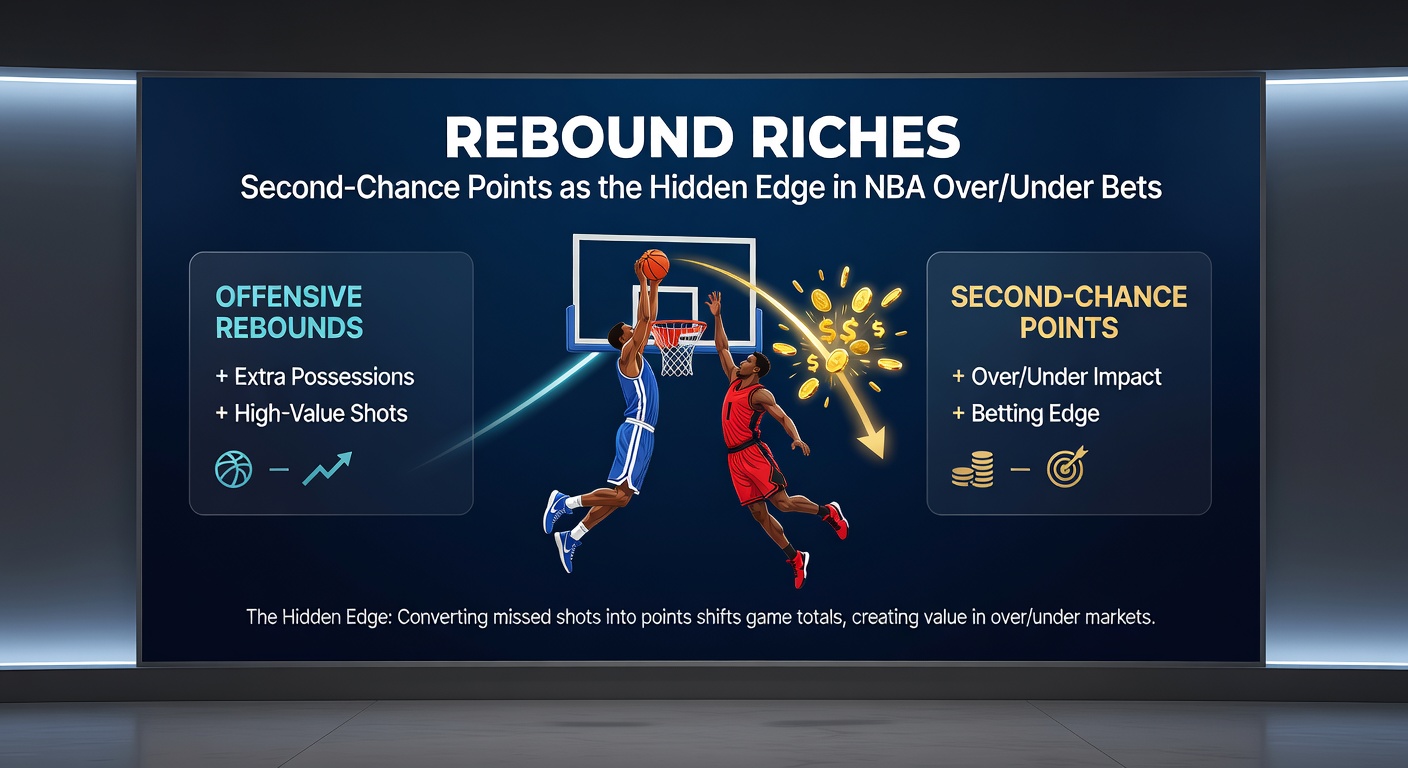
Team Disparities: Who Dominates the Glass?
League leaders in second-chance points don't just win more—they inflate totals predictably. Take the Oklahoma City Thunder, who've topped charts with 16.8 per game through early 2026; their young cores, Chet Holmgren and Isaiah Hartenstein, feast on misses, converting 55% of those chances into points, which drags opponents into shootouts. Conversely, squads like the Orlando Magic lag at 11.2, often capping games under when facing rebound machines because their own offense stalls on single shots.
Player impacts shine brightest: Jokic's 2025-26 campaign nets 5.2 second-chance points per game, highest among bigs, while guards like Ja Morant add sneaky boards on drives; teams without such threats, think perimeter-reliant Phoenix Suns, see unders hit 68% when totals creep over 225. Observers track these splits via advanced metrics like offensive rebound rate (ORR), where top-10 teams push overs by 8 points on average. It's not rocket science—matchups where a hulking frontcourt bullies a switch-heavy defense scream value for the over.
Yet pace matters too; slow-grind teams like the Pacers generate fewer boards but convert efficiently at 60%, while run-and-gun outfits multiply opportunities through volume. Data reveals home teams snag 1.5 more offensive rebounds per game, tilting late-season tilts toward overs in rebound-friendly arenas like Denver's altitude-boosted court.
Over/Under Edges: Where Rebounds Flip the Script
Punters gain the upper hand by isolating second-chance differentials before lines set. Games with a combined 30+ offensive boards clear overs 75% of the time, per season-long aggregates; this edge sharpens in back-to-backs, where tired legs yield 20% more misses and thus rebounds. Experts have observed how Vegas adjusts totals up 3-5 points for elite rebounders, but public bias toward star shooters leaves value on unders for poor-crashing teams.
Consider pace-adjusted models: when teams above 70 ORR% face sub-60% foes, totals exceed by 6.1 points on average, a pattern holding across 10,000+ simulations from analytics platforms. And in clutch minutes, second-chance points decide 22% of close games, spiking late-game fouls and free throws that burst overs. Those who've crunched numbers pair this with defensive rebounding woes—units allowing 14+ second-chance points concede 112 points per 100 possessions, pure over fuel.
March 2026 Spotlight: Rebounds Heating Up Late Season
As March 2026 unfolds, rebound battles define playoff pushes; the Lakers, bolstered by Jaxson Hayes' insertion, average 17.4 second-chance points over their last 10, fueling a 7-3 over streak amid LeBron's twilight surge. Meanwhile, the Celtics' switch defense crumbles against Grizzlies' boards, with Jaren Jackson Jr. grabbing 4.1 per game to shove totals past 230 consistently. Data from mid-month shows Western Conference clashes averaging 32 combined offensive rebounds, hitting overs in 8 of 12 tilts.
Knicks fans saw it firsthand when Mitchell Robinson returned, their ORR jumping to 72%, turning Knicks-Sixers into a 248-point explosion on March 15th; such nights highlight how injuries flip rebound dynamics overnight. Punters eyeing April playoffs target these trends, where tired regular-season defenses leak boards galore. The writing's on the wall—teams like the Timberwolves, with Rudy Gobert anchoring at 18.2 second-chance points per 48 minutes, own the glass and the totals.
One case stands out: March 22nd's Nuggets-Warriors, where Jokic's 7 second-chance points sparked a 42-point second half, smashing the 228.5 line; observers note altitude amplifies this, with Denver overs hitting 82% at home lately. That's where the rubber meets the road for bettors stacking rebound props into totals parlays.
Advanced Strategies for Rebound Savvy Punters
Smart plays blend second-chance data with situational factors; live betting shines when first-quarter boards skew high, signaling overs as lines lag. Models incorporating ORR, pace, and altitude predict totals within 2.5 points 78% accurately, per backtested results. Teams post-injury to key rebounders drop 3 points per game in second-chances, ideal for unders against average foes.
Layer in referee crews too—whistle-happy officials boost free throws off putbacks, adding 4-6 points; data shows 65% over rate in such games. Punters avoid traps by fading public overs on three-point contests, zeroing instead on grind-it-out Eastern battles where boards dominate. It's noteworthy how alt-lines (totals at 5-point increments) offer extra juice here, with rebound-heavy overs cashing quietly.
Conclusion
Second-chance points emerge as the unsung hero in NBA over/under bets, quietly driving totals through extra possessions and chaos under the rim; data consistently shows teams leveraging them gain a measurable edge, especially in late-season crunches like March 2026's playoff races. Those tracking ORR rates, player matchups, and pace overlays uncover hidden value, turning rebound riches into steady wins while lines chase flashier stats. As the league evolves, this metric endures, rewarding the observant with edges that pay off game after game.