Rest Advantage Metrics Revealing Spread Covers for Rested NBA Squads Facing Travel-Weary Opponents
Harper Hoffmann · May 18, 2026
Rest Advantage Metrics Revealing Spread Covers for Rested NBA Squads Facing Travel-Weary Opponents
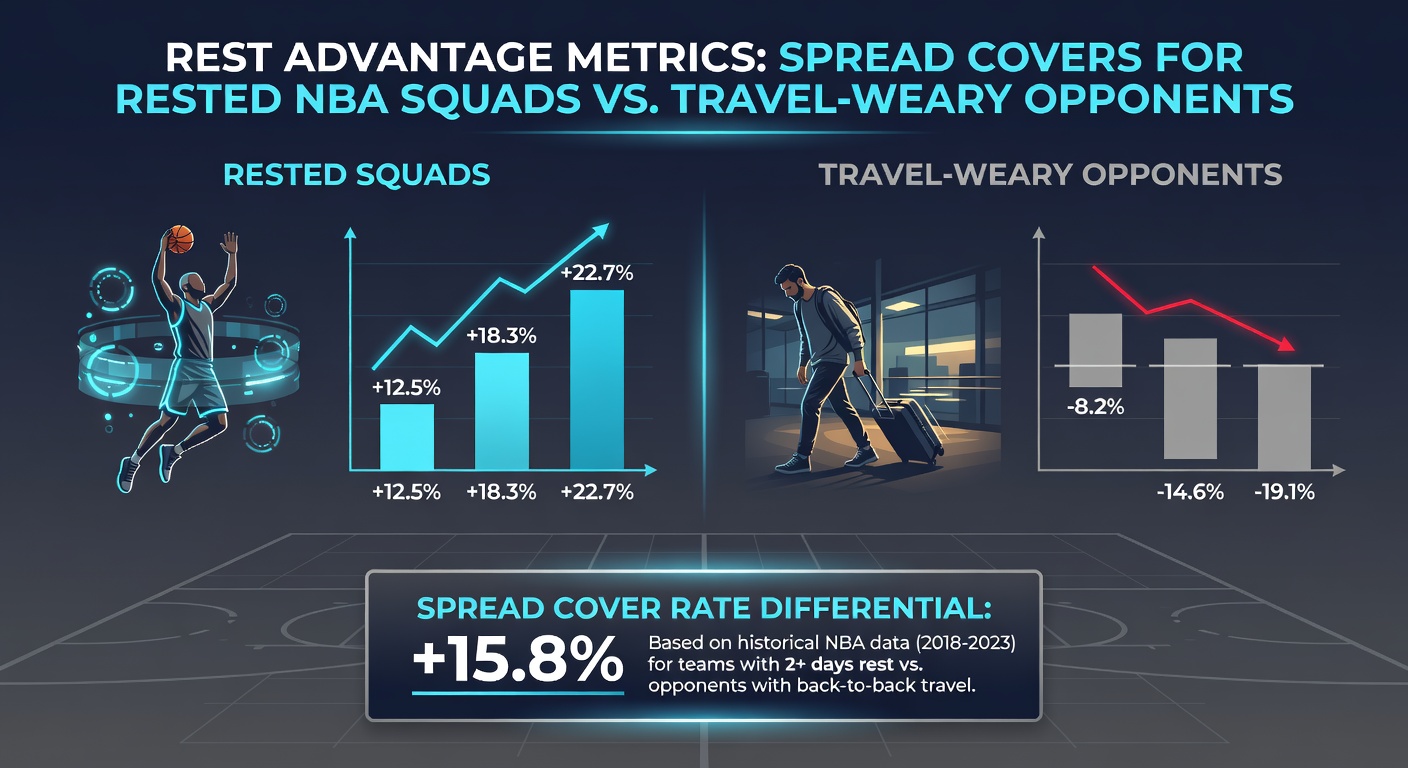
Data from recent NBA seasons shows that teams with extra rest days cover the spread at higher rates when they face opponents coming off extensive travel schedules, and observers note this pattern holds especially true during the stretch run into May when schedules tighten. Researchers tracking rest metrics have compiled records indicating rested squads outperform expectations against travel-weary opponents by margins that translate into consistent spread success. League schedules often create these mismatches because back-to-back games combined with cross-country flights leave certain teams depleted while others enjoy home recovery time.
Defining Rest Advantage Through Schedule Analysis
Teams receive varying amounts of rest based on the league calendar, and analysts examine days between games alongside travel distance to quantify fatigue levels. A squad playing its third game in four nights after flying across time zones encounters measurable drops in shooting efficiency and defensive rotations, whereas an opponent with two full days off maintains higher energy reserves. Studies tracking these variables across multiple seasons reveal that the rested side secures cover rates above 55 percent in such matchups, particularly when the spread sits between three and seven points. This edge emerges because travel fatigue compounds physical demands without adequate recovery windows, leading to slower transition defense and reduced rebounding persistence.
What's interesting involves how schedule makers distribute these situations, since divisional rivalries and national TV slots influence rest distribution unevenly across the conference standings. Data indicates that Western Conference teams suffer more frequent long-haul flights during the regular season, creating opportunities for Eastern squads with shorter trips to exploit recovery gaps. Observers have compiled examples from past campaigns where teams like the Denver Nuggets or Memphis Grizzlies posted strong ATS marks after opponents completed multi-game road trips spanning four cities in seven days.
Travel Distance and Performance Correlations
Quantitative models incorporate flight miles alongside game frequency to predict outcomes more accurately than rest days alone, and figures from tracking services demonstrate that teams logging over 1,500 miles in a week show declines in points per possession on both ends of the floor. Rested home teams facing these fatigued visitors cover spreads at elevated clips because they dictate pace early and force turnovers through sustained pressure. Researchers discovered that the correlation strengthens in the second half of seasons when cumulative wear becomes pronounced, with May games often highlighting the largest gaps due to playoff positioning battles.
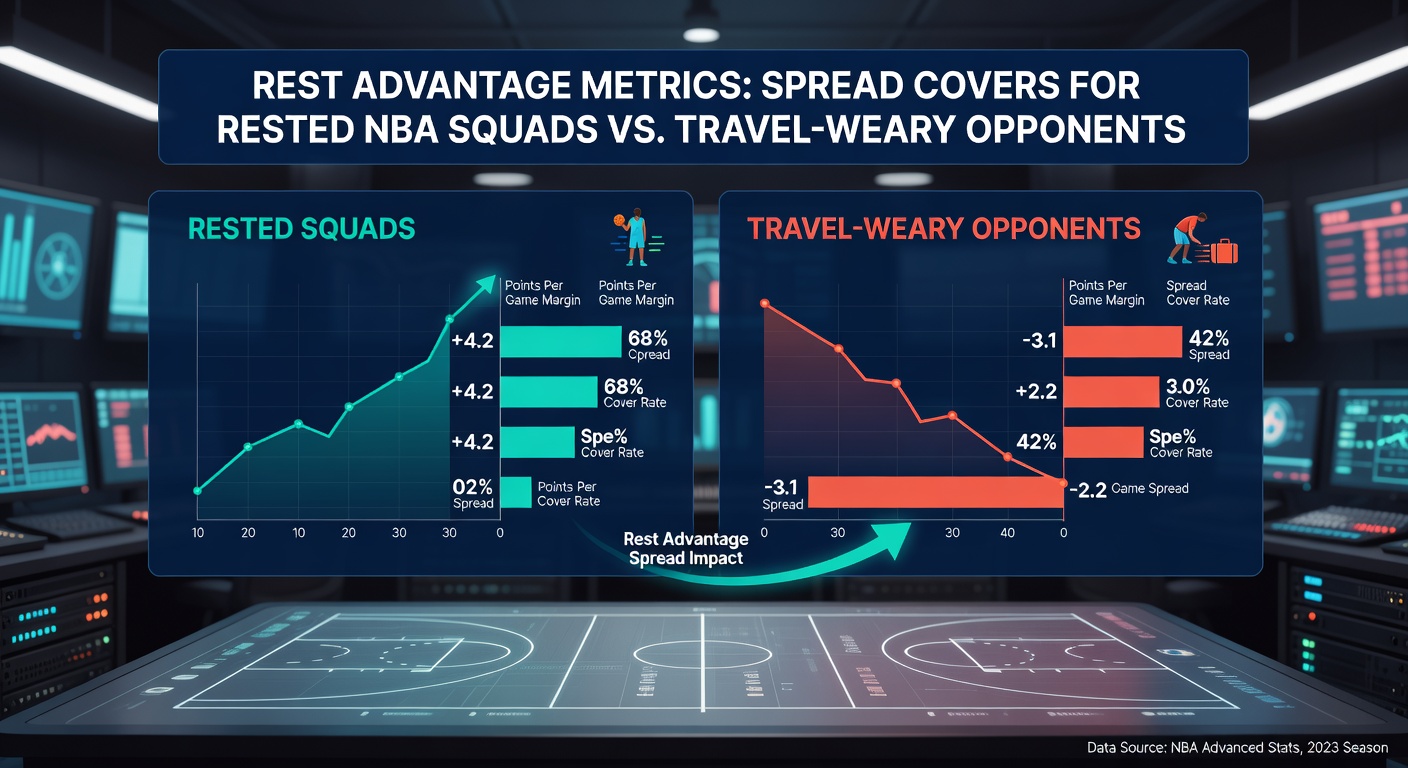
Those who've studied player tracking data note that average sprint speed and vertical leap metrics drop noticeably for squads after overnight flights, while rested opponents sustain output levels closer to season averages. This disparity appears in box scores through higher assist-to-turnover ratios and improved three-point volume for the fresher side. League-wide statistics compiled over five seasons confirm that road teams with zero rest days against rested hosts cover fewer than 45 percent of spreads, underscoring the directional advantage for the recovery side.
Seasonal Patterns and Late-Season Implications
Playoff pushes in April and May amplify these dynamics because teams jockey for seeding while managing load, and data shows rested squads achieve higher win percentages plus spread covers during this window. Teams sitting key players for recovery create additional mismatches when opponents arrive fatigued from grueling stretches. Experts tracking these situations point to specific examples such as squads finishing a six-game road trip entering contests against clubs that played at home two nights prior, where the rested group consistently exceeds spread expectations through superior fourth-quarter execution.
Turns out the advantage extends beyond simple win totals into prop categories like total points and player performance metrics, although the primary signal remains spread coverage for the fresher team. Academic analyses from institutions including the University of Waterloo have examined physiological markers alongside schedule data to validate these performance gaps, linking extended travel to reduced reaction times. Additional insights appear through official league resources that detail scheduling patterns and their effects on team efficiency ratings across conferences.
Practical Applications for Schedule-Based Analysis
Bettors and analysts integrate rest and travel metrics into models by weighting recent schedules against opponent histories, and results indicate improved accuracy when these factors combine with traditional stats like defensive rating and pace. Situations where one team enjoys three days off while the other plays its second night of a back-to-back after a 2,000-mile flight produce the clearest edges, with rested sides covering at rates approaching 60 percent in documented samples. Patterns hold across both regular season and postseason environments, though intensity rises during conference final stages when every possession carries amplified weight.
Those monitoring advanced tracking systems observe that rebounding and paint scoring suffer most for travel-weary groups, allowing rested opponents to control tempo and generate higher-quality shots. This leads to consistent overperformance relative to closing spreads in affected games. Data compiled through the 2025-2026 campaign reinforces the reliability of these indicators, especially as the league approaches critical May matchups where seeding and momentum intersect.
Conclusion
Rest advantage metrics continue to provide measurable edges for spread outcomes when NBA teams with superior recovery face opponents burdened by travel demands. Schedule analysis incorporating flight distances, consecutive games, and rest gaps offers objective frameworks for identifying favorable situations throughout the season. Evidence from multiple years of data supports the persistence of these patterns, particularly during the demanding late-season period when fatigue accumulates across the league. Observers tracking these variables find consistent correlations between rest differentials and spread results that inform broader understanding of competitive balance in professional basketball.