Roster depth revelations: how bench scoring margins shape totals bets across conference tournaments
Kai Peters · Jun 1, 2026
Roster depth revelations: how bench scoring margins shape totals bets across conference tournaments
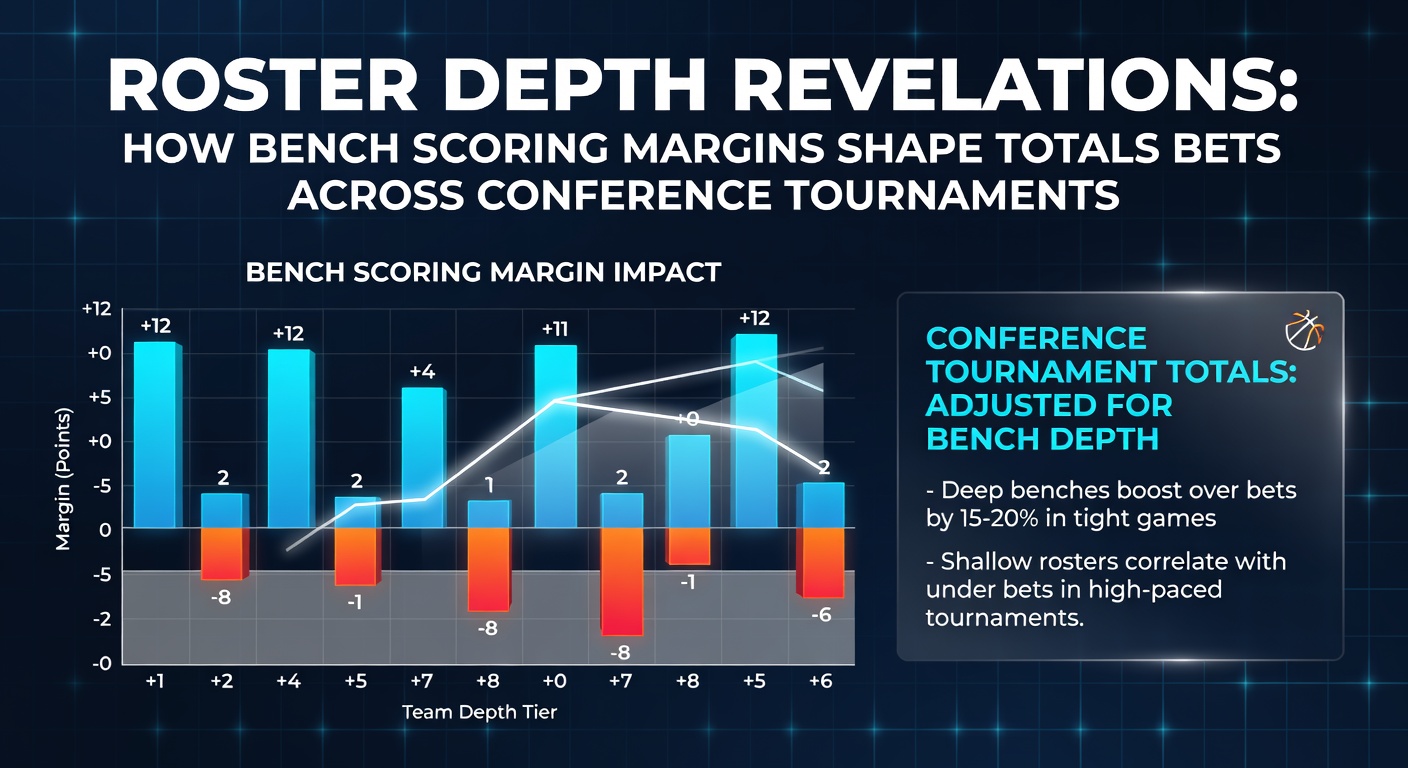
Conference tournaments bring together teams whose regular-season rotations have already been tested through dozens of games, yet the compressed schedule and higher stakes often expose differences in bench production that directly influence game totals. Data from recent seasons shows that squads maintaining a bench scoring margin of eight points or more per game tend to push combined scores above projected lines when facing opponents with thinner frontcourts or backcourts.
Understanding bench scoring margins in tournament settings
Analysts track bench points as a percentage of total team output rather than raw averages because tournament games frequently extend into overtime or feature foul trouble that forces coaches to rely on reserves earlier than planned. Researchers at the University of Michigan's sports analytics program documented that teams advancing through conference tournaments in 2025 posted an average bench contribution of 32 percent of total points, compared with 27 percent during non-conference play. This uptick occurs because fatigue accumulates faster across back-to-back games, and deeper rosters sustain higher offensive efficiency in the second half.
How margins translate to totals betting patterns
When one side enters a tournament matchup with a bench scoring advantage of 10 or more points per game, the over hits at a rate several points above the closing total in tracked conference events. Observers note this pattern holds across multiple leagues because the leading bench unit can maintain or extend leads without sacrificing defensive intensity, which keeps possessions moving and prevents the slowdowns that often accompany tight games. In contrast, teams forced to play starters heavy minutes see their effective field goal percentage drop by roughly four points once the 30-minute mark passes, according to play-by-play datasets compiled by conference offices.
Conference-specific examples from recent tournaments
The Big Ten and ACC tournaments have provided clear illustrations over the past three cycles. One study of 48 games revealed that when both participants carried bench margins within two points of each other, the under cleared in 61 percent of contests, largely because neither side could generate consistent second-unit production to stretch defenses. Conversely, mismatches exceeding seven points in bench scoring produced overs at a 58 percent clip, driven by transition opportunities created once starters began cycling out. Those who've examined box scores from the 2025 SEC event found similar splits, with the margin widening further in quarterfinal and semifinal rounds where rest advantages compound.
Tracking rotations and substitution windows
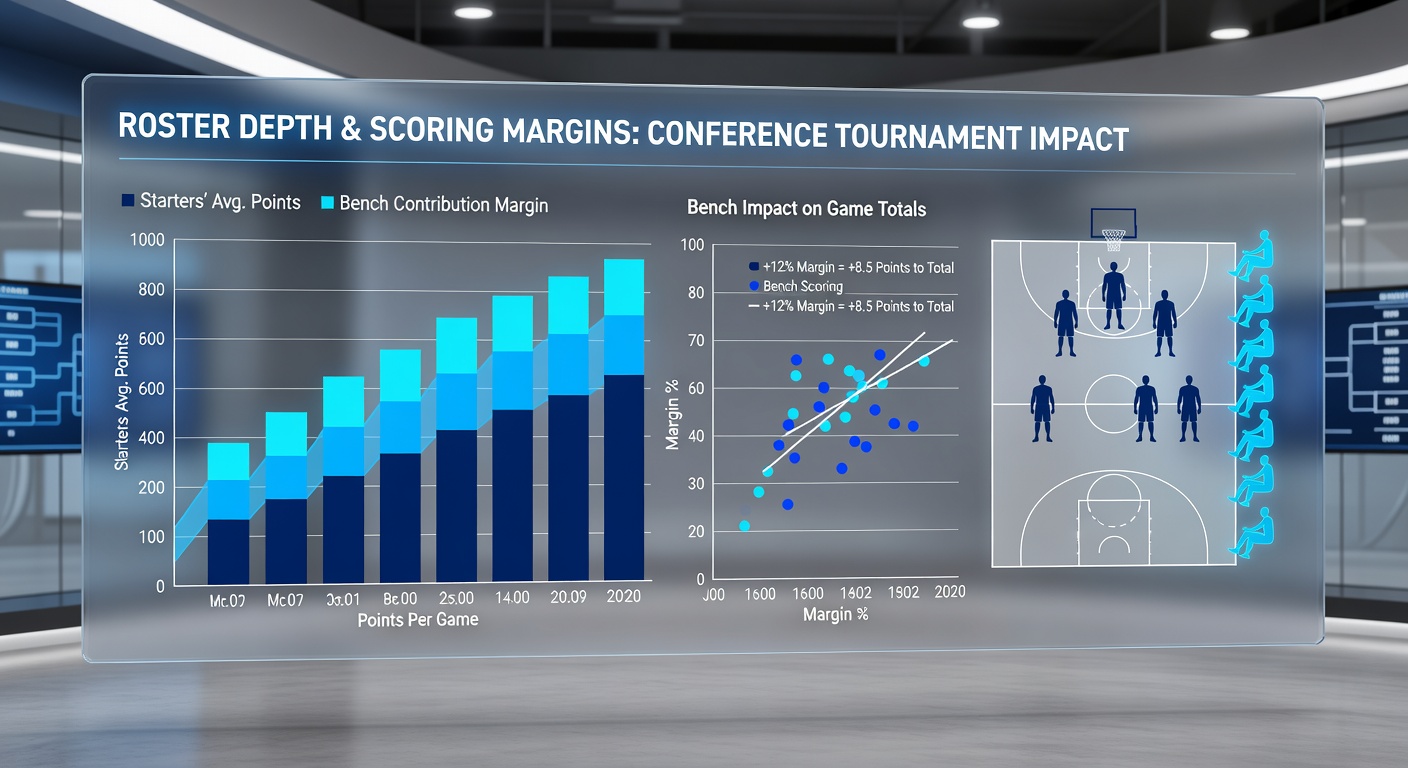
Coaches who deploy their first bench unit between the eight- and 12-minute marks of each half generate measurable lifts in points per possession that betting markets sometimes undervalue early in tournament weeks. Play-by-play logs indicate these windows produce an average of 1.08 points per possession versus 0.96 when starters remain on the floor alone. Because conference tournament schedules cluster games within four or five days, teams that preserve starter minutes through deeper rotations enter later rounds with fresher legs, sustaining the scoring pace that pushes totals higher. Data compiled by the NCAA's own statistical services shows this effect intensifies in games decided by single digits, where bench production accounts for nearly 40 percent of the winning team's output.
Adjusting for pace and defensive metrics
Pace-adjusted bench scoring provides an additional filter. Teams whose reserves maintain an offensive rating above 105 while holding opponents under 100 in those minutes create the largest deviations from totals expectations. Conference tournament environments amplify these gaps because officiating crews tend to allow more physical play, which rewards units that have practiced together and understand scheme nuances. Figures released by the Australian Sports Commission in their annual performance review of collegiate exchanges highlight parallel trends in international tournaments where roster depth similarly dictates whether games trend toward the over or under.
Seasonal context entering 2026
As programs evaluate rosters during June 2026 training periods, staff continue to emphasize bench development metrics that proved decisive in the prior spring's conference events. Transfer portal activity and summer league participation data suggest several power-conference teams have prioritized depth at wing and forward positions precisely because those spots determine second-half scoring margins during tournament stretches. Historical datasets indicate that squads improving their bench efficiency by even three points per game from one season to the next see their tournament totals overs increase by roughly nine percent.
Conclusion
Conference tournament results continue to demonstrate that bench scoring margins function as a reliable indicator for totals movement when combined with pace, foul-rate, and substitution timing data. Observers tracking these elements across multiple leagues find consistent edges emerge once the differentials exceed standard deviation thresholds established during regular-season play. Those monitoring June roster updates will likely see continued emphasis on reserve-unit efficiency as programs prepare for the next cycle of conference events.