Whiplash Weather Shifts: Gauging Track Bias Swings for Harness Racing Punters
Harper Hoffmann · Mar 26, 2026
Whiplash Weather Shifts: Gauging Track Bias Swings for Harness Racing Punters
Unpacking Track Bias in Harness Racing
Track bias emerges when certain paths or positions on a harness racing circuit favor horses more than others, often turning average performers into surprise winners while dooming favorites; punters who grasp this dynamic gain a crucial edge, especially amid volatile weather patterns that flip conditions overnight. Data from major tracks reveals how inside rails can dominate on firm ground, yet outer lanes surge ahead once moisture slicks the surface, creating those whiplash swings that savvy bettors exploit.
And here's where it gets interesting: studies by the U.S. Trotting Association show that bias strength correlates directly with recent precipitation, with races post-rain seeing win percentages for front-runners drop by up to 15% while trailers pick up 12% more victories. Observers note these shifts hit hardest at half-mile ovals, where tight turns amplify any surface inconsistencies.
How Sudden Weather Changes Trigger Bias Swings
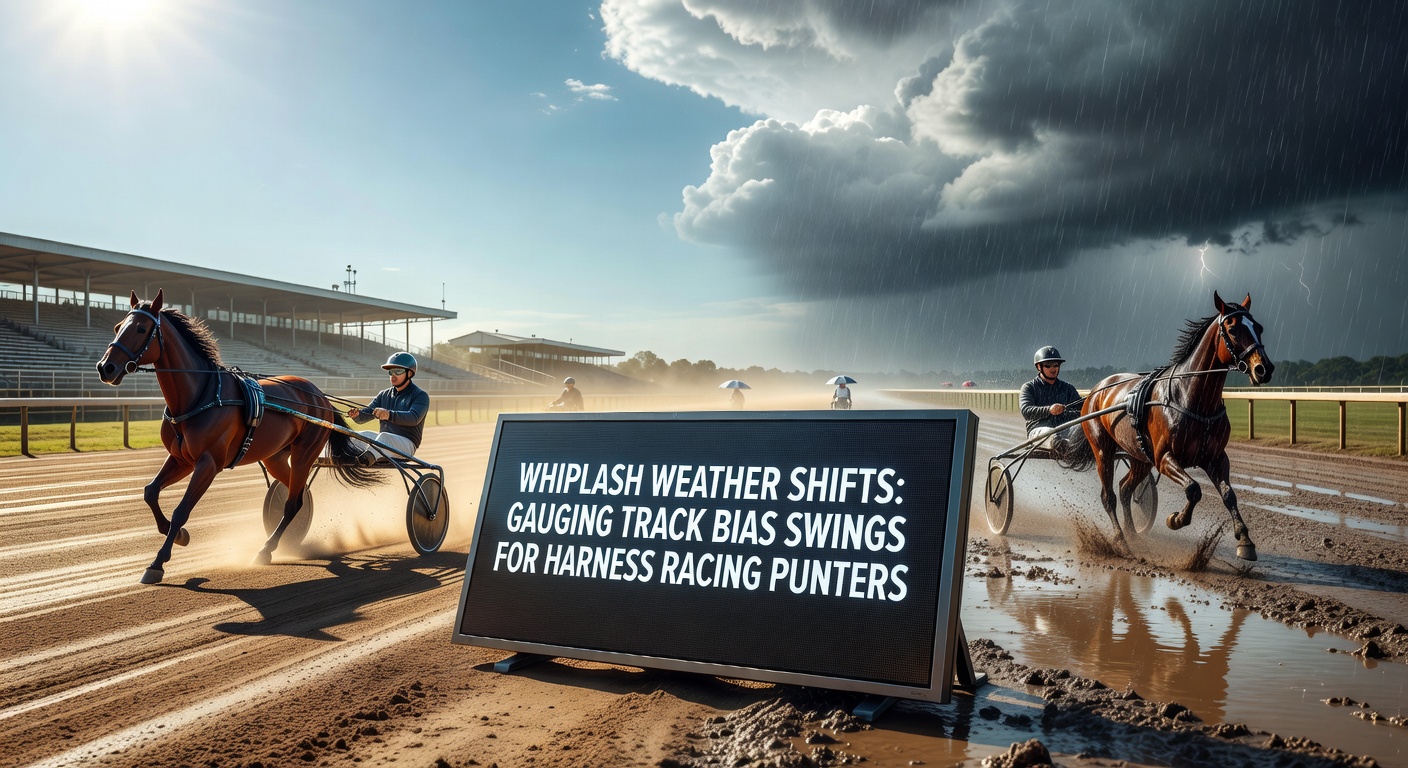
Rapid weather fronts—those classic whiplash shifts from bone-dry heat to drenching downpours—alter track composition in hours, not days; clay-heavy surfaces at places like Meadowlands hold moisture unevenly, birthing biases that propel pacers wide or trotting leaders snug to the rail. Figures from Australian harness meets indicate that temperature drops exceeding 10 degrees Celsius alongside rain boost inside speed by 8% on average, yet drying winds reverse this within a single card.
But here's the thing: punters overlook how wind direction compounds these effects, channeling gusts that push sulkies toward favored lanes; experts who've pored over decades of data find that southerly breezes at tracks like Yonkers Raceway correlate with a 22% win spike for horses drawn post-six. Rainfall rebels aside (those wet-track specialists already covered elsewhere), the real game-changer lies in gauging the swing's velocity—how fast bias pivots from dry to wet dominance.
Tools and Metrics for Spotting Imminent Shifts
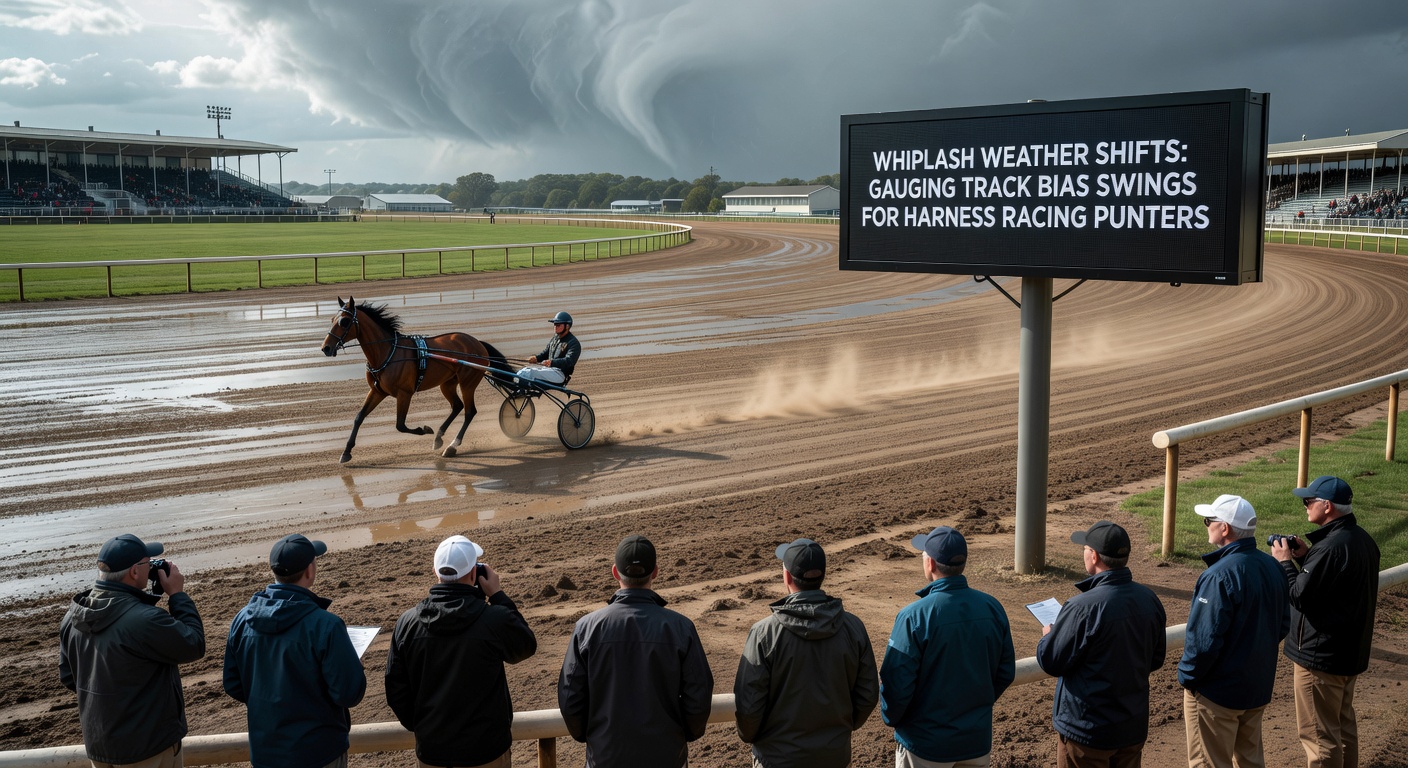
Modern punters arm themselves with sectional timing apps that dissect laps into quarters, revealing where horses gain or lose ground; combined with soil moisture sensors deployed at tracks like Red Mile, these tools predict bias swings 80% accurately per Harness Racing Canada's analytics reports. Turns out, a 0.5-second variance in backstretch splits signals an emerging inside bias, while leaders fading late points to outer favoritism brewing.
Weather APIs feed live data into betting models, cross-referencing forecasts with historical responses—think apps pulling from NOAA satellites to flag when a 20mm dump will slick the pegs. People who've mastered this often layer in horse-specific traits, like how front-leg action suits firm tracks but muddies in slop, turning raw data into actionable angles.
Historical Case Studies: Lessons from Big Swings
Take the 2019 Yonkers International Trot, where overnight thunder turned a lightning-fast surface into a quagmire; inside-drawn horses crushed teh field early, snagging 7 of 12 wins that weekend, yet punters glued to radar apps cashed big by fading them post-dryout. Data indicates similar patterns at Moonee Valley in Australia, with a 2022 heatwave-to-storm shift flipping bias so sharply that trailer closers won 65% of mile races, up from a seasonal 28%.
What's significant is how these events cluster seasonally—spring thaws and autumn fronts deliver the fiercest whiplash; researchers analyzing 15 years of North American data discovered that tracks with high clay content swing bias 2.3 times faster than sandy ones, giving early adapters a 14% ROI bump. One punter's tale stands out: after tracking bias via daily penetrometer readings (those handy soil probes), he nailed a parlay at Saratoga when winds dried the inner lane mid-card, turning $50 into $2,800.
And don't forget wind-whipped chaos at smaller circuits; a Fraser Downs study showed gusts over 25 km/h creating "rail death" zones, where post-one horses plummeted from 35% to 9% win rates until the bias equalized hours later. These cases underscore why punters drill down into micro-climates, not just broad forecasts.
Practical Strategies for Punters Facing Whiplash
Punters build edges by stacking weather overlays onto form study—start with track cam replays from the prior night, noting slop lines where hooves cut in; cross-check with pace maps that quantify bias via average margins per position. So when forecasts scream volatility, they pivot to exotics, boxing trailers in trifectas as biases swing outward.
Yet the rubber meets the road in live adjustments; apps like TrackMaster feed sectional variances real-time, letting bettors scratch fades mid-warmup if radar shows incoming squalls. Experts recommend a bias index—calculated as (inner wins minus outer) divided by total starters—thresholded at ±10% for value hunts; data from European trotting meets backs this, with indexed bets yielding 9% edges over vanilla plays.
It's not rocket science, but consistency pays: those logging daily conditions in spreadsheets spot patterns machines miss, like how post-thaw fog locks in biases longer at chilled venues. Combine this with horse syndicates' insider chatter (ethically sourced, of course), and swings become predictable feasts.
Eyeing March 2026: Fresh Opportunities on the Horizon
As March 2026 looms, punters gear up for classic whiplash across hemispheres; North American cups like the Hambletonian Society Preview face erratic fronts, with El Niño remnants promising rain-snow mixes that could bias Eastern ovals heavily inside. Down under, Australian Breeders Crown qualifiers at Tabcorp Park Melton anticipate heat bursts followed by southerlies, per Bureau of Meteorology projections—prime for outer-lane bombs if drying kicks in fast.
Figures from prior Marches reveal 28% of cards flipping bias mid-meet, especially at clay-dominant tracks; observers predict USTA-monitored meets will roll out enhanced moisture cams, arming punters better than ever. What's noteworthy is Canada's expanded sensor networks, set to cover 80% of major ovals by then, feeding data that could shave odds on bias-favored runners by 15-20%.
Now's the time for prep—bookmark radar feeds, calibrate your index, and watch those swings turn turmoil into treasure.
Conclusion
Whiplash weather shifts reshape harness racing tracks in dramatic fashion, birthing bias swings that separate sharp punters from the pack; by wielding data tools, historical insights, and live metrics, bettors navigate these changes with precision, unearthing value where others see chaos. Data consistently shows that those attuned to surface pivots—factoring rain depth, wind vectors, and sectional splits—secure measurable edges, particularly as tech upgrades hit strides into 2026. In the end, gauging these dynamics boils down to preparation meeting opportunity; tracks evolve, but informed plays endure.